The US EPA and many international agencies have placed limits of the sulfur content contained in fuels in order to limit greenhouse gas emissions. Petroleum refining companies therefore need to monitor the sulfur in their products and inspection companies need to be able to analyze sulfur easily and at increasingly lower concentration levels. One of the most common analytical tools for performing this type of analysis is Wavelength Dispersive X-Ray Fluorescence spectrometry (WDXRF).
The analysis of sulfur in fuels is a relatively easy application for most modern wavelength dispersive X-ray fluorescence (WDXRF) spectrometers. The challenge arises when attempting to analyze S at low ppm levels consistently over time. Many instrument manufacturers provide application templates for ASTM and ISO norms that can be calibrated with certified reference materials from ISO 17034 accredited suppliers. Most instruments have calculated lower limits of detection (LLDs) in the sub ppm range, however accurately quantifying at the single digit ppm level requires that extra care be taken during application set-up to ensure stability of the results at the lowest edge of the calibration curve.
Long-term precision of low S levels suffers when the monitor correction isn’t optimized for the application. If the monitor is not set up properly, it can become the largest source of error, causing time-consuming re-calibration every time your check standards fail.
This blog post will describe some of the common sources of drift within a typical WDXRF spectrometer, and demonstrate a better way to correct for all of the drift factors in your system.
Sources of Error/Drift within WD XRF Spectrometer
Even the best WDXRF spectrometer will have some decrease in signal over time, aka drift.
.jpg?width=333&name=S%20Fuels%20test%20(2).jpg)
There are several known sources of drift in XRF spectrometry, and generally, the largest contribution to drift is aging of the x-ray tube. Other sources of drift are variation in the Helium flush used for liquid analysis, differences in the thickness and/or inherent contamination in the support film selected for analysis and contamination/aging of the components within the optical path. All XRF manufacturers include some form of drift correction/calibration update capability within the spectrometer software, which, when implemented correctly, can be utilized to correct for all of the aforementioned factors. Unfortunately, when not done correctly, drift correction becomes the largest source of error in the results, and traditional glass drift monitor samples are not ideal for correction of low sulfur in fuels.
Drift Monitor Correction
GLP requires that the drift correction sample be stable over-time, such that variation in the sample itself does not add to the variation in the measured intensity, and also that the intensity of the monitor sample be close to the maximum intensity of the calibration curve. This la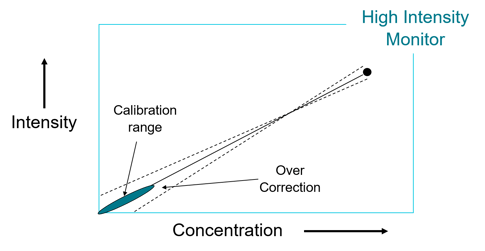 st point is important, because if the intensity of the monitor sample is significantly different from the intensity of the typical sample in the calibration curve, minor variations in the measured intensity could cause a lever effect and over-correction of the calibration, causing your checks to quickly drift out of range.
Very commonly, solid glass disks such as the AusMon are selected as monitor samples. These glass disks are great for use with many applications, but are not the best choice for a low sulfur in fuels application. The intensity of the sulfur in the disk is roughly 10x higher than that in a typical 100 ppm low S in fuels calibration sample. Additionally, sulfur in the glass is oxidized, which for S, causes a slight shift of approximately 0.08° in the position of the peak. It is much more accurate to obtain a stable sample with elemental S in the range of the calibration, to avoid this peak shift problem.
.png?width=582&name=Polysulfide%20Peak%20(2).png)
The perfect monitor sample for low S in fuels would be a stable organic liquid, such as mineral oil, with a stable non-oxidized form of sulfur, such as polysulfide, that falls within the calibration range. Having a liquid monitor requires that it be run in exactly the same manner as the calibration/analysis samples, which corrects for drift from the optical path, as well as any variation in helium flush and the sample support film. Using polysulfide negates the peak shift issue caused when the monitor contains oxidized sulfur.
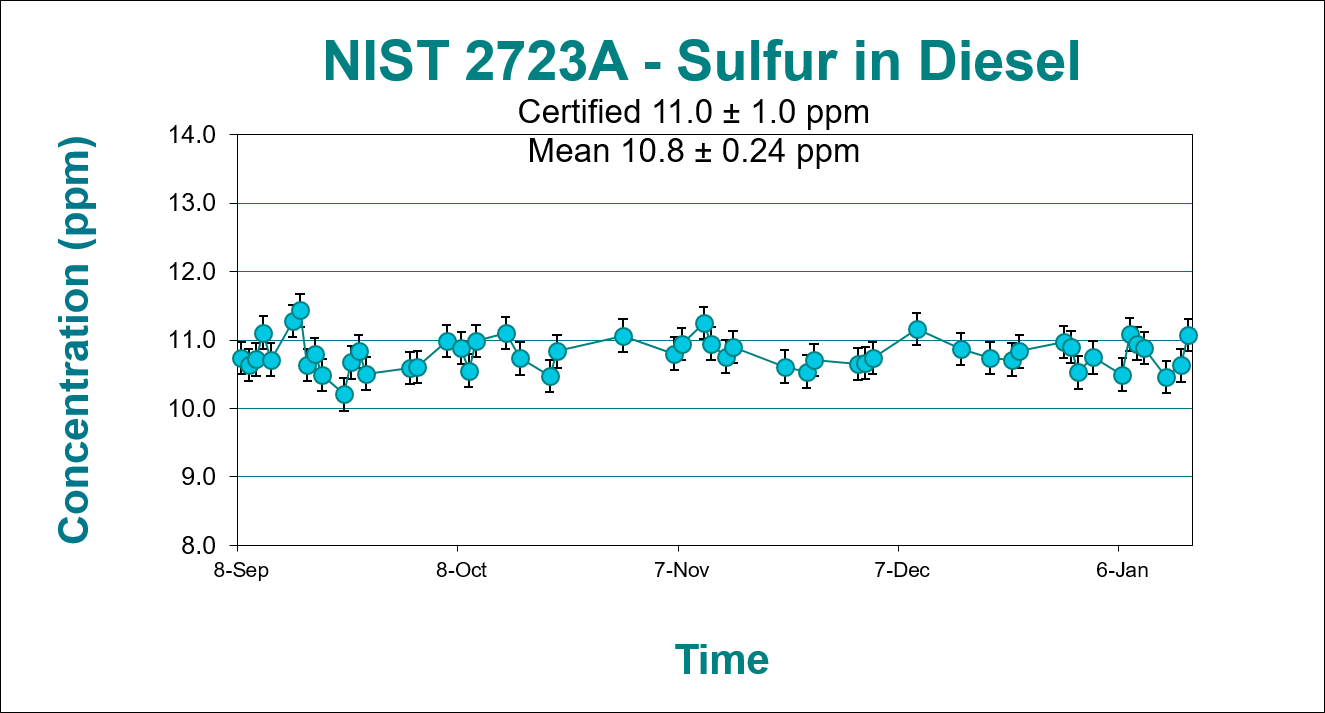
ASTM method D2622 lists requirements for both short-term and long term reproducibility. When properly set up, the short-term precision is easily achieved. Long term precision can be more difficult without a properly set-up monitor program. The data below for long-term precision was calculated with measurements performed over a 4 month period. The NIST standard for S in diesel, 2723A was utilized for the measurements. By correcting for all potential factors of drift, the data stays well within the reproducibility limits of D2622. Giving some forethought into your monitor selection, it is easy to maintain this precision over time, saving time and money in calibration costs.
Using these ISO 17034 calibration solutions, it is easy to achieve the demonstrated precision over time.
ARMI | MBH can provide a complete range reference materials and instrument monitors for the analysis of S in fuels. Need some help ? Ask our experts.